
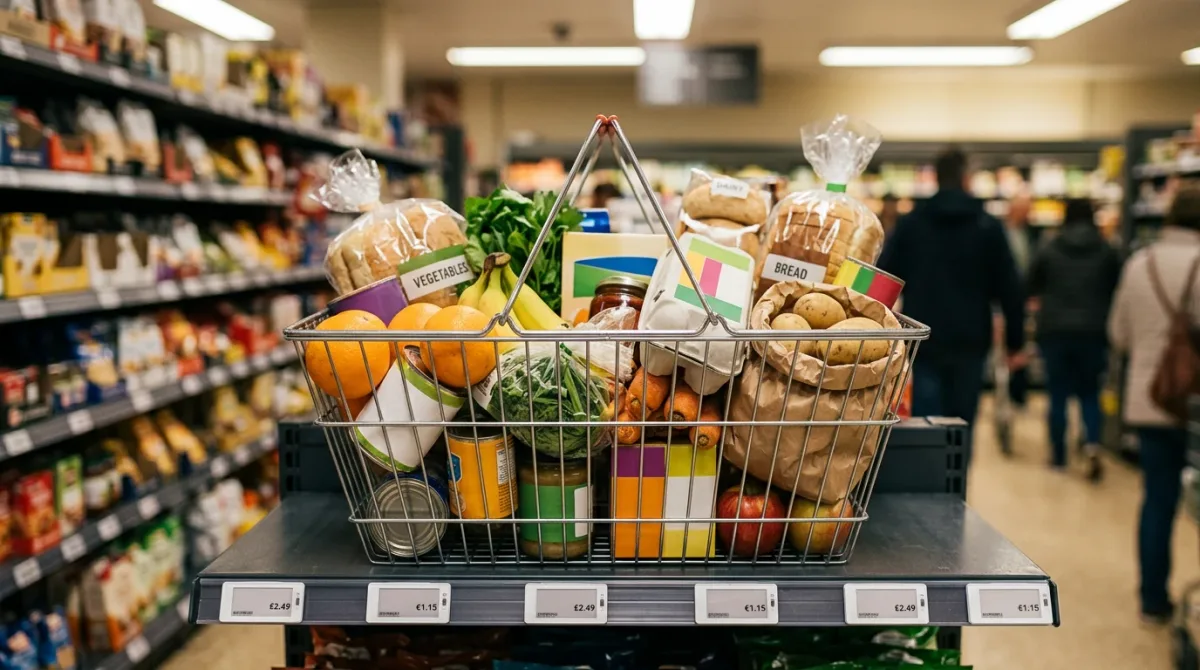
The Consumer Price Index is built each month from roughly 80,000 individual price quotes collected by the U.S. Bureau of Labor Statistics, according to the agency's CPI technical notes. Those prices are combined using expenditure weights drawn from a separate household survey, then aggregated through a two-stage statistical process into the single index figure reported publicly each month.
The CPI is a government-run price survey that tracks how much a fixed set of goods and services costs over time, expressed as an index number rather than a dollar figure. It is not a forecast, and the Bureau of Labor Statistics (BLS) does not use it to predict future prices, rates, or market direction — the index only measures prices already collected.
What does the CPI actually measure?
The index tracks average price change for a market basket of consumer goods and services bought by urban households, organized into eight major groups: food and beverages, housing, apparel, transportation, medical care, recreation, education and communication, and other goods and services, per BLS. Those groups are broken down further into more than 200 detailed expenditure categories.
Two versions of the index exist side by side. CPI-U covers all urban consumers, representing more than 90% of the U.S. population, while CPI-W is limited to wage and clerical worker households, about 30% of the population, the bureau states. Both use 1982-84 as the base period, set equal to 100; a separate chained index, C-CPI-U, uses December 1999 as its base.
Geographically, the index is organized into 23 metropolitan areas, 4 regions and 9 divisions, per the bureau's published concepts. Priced goods and services span everyday categories such as food, clothing, shelter, fuels, transportation, and doctors' and dentists' services, and the index includes all purchase-related taxes on those items.
How does BLS choose which stores and areas to price?
Selecting what to price is itself a multi-stage sample, according to the bureau's technical notes. In the first stage, BLS selects a sample of geographic areas. In later stages it selects a sample of retail outlets within those areas, and then a sample of specific goods and services to price inside each outlet — the process that eventually yields the roughly 80,000 monthly price quotes described above.
How does BLS collect the underlying prices?
Data collectors record prices each month in 75 urban areas nationwide, drawing from about 6,000 housing units and roughly 22,000 retail establishments — department stores, supermarkets, hospitals and other outlets, according to the bureau's technical notes. Fuel and a handful of other items are priced monthly in all 75 areas; most other goods and services are priced monthly in the three largest areas and every other month elsewhere.
Those collected prices then feed a separate calculation stage built around 32 geographic index areas and 243 basic item categories, producing 7,776 distinct item-area price indexes as the first layer of the index's math, the bureau's calculation methodology shows.
Where do the weights come from?
Prices alone don't make an index — each item needs a weight reflecting how much households actually spend on it. Those weights come from the Consumer Expenditure Surveys, a separate BLS program in which, as of 2023 CPI data, more than 20,000 consumer units reported their spending each quarter in an interview survey, and roughly 12,000 more kept two-week diaries of everyday purchases.
There is a built-in lag between that spending data and its use in the CPI: 2023 index calculations relied on Consumer Expenditure Survey data collected in 2021, the bureau notes. That means the basket's weighting reflects household spending patterns from roughly two years earlier than the index it feeds.
How are raw prices turned into a single index number?
The calculation happens in two stages. First, BLS computes "basic indexes" for each item-area combination — ice cream in Chicago, for example — using one of two formulas. Most item categories use a weighted geometric mean of price ratios, comparing an item's current price to its price the previous period. A smaller set of categories, including selected shelter and utility services, government fees, and several medical care services such as prescription drugs and hospital services, instead use a modified Laspeyres formula based on weighted average prices.
In the second stage, those thousands of basic indexes are combined into higher-level indexes — up to the broad all-items U.S. city average — using the expenditure weights from the Consumer Expenditure Surveys described above.
| Stage | What it produces | Scale, per BLS |
|---|---|---|
| Basic index calculation | Item-area price indexes (e.g., ice cream, Chicago) | 243 basic items × 32 geographic areas = 7,776 combinations |
| Aggregation | Higher-level and all-items indexes | 211 item strata combined using Consumer Expenditure Survey weights |
How does BLS handle products that change or disappear?
When a priced item is discontinued or altered, BLS field staff select a replacement item or record the quality change directly — a process the bureau calls substitution. Data specialists then check for accuracy and make adjustments that can range from correcting for a change in package size to more complex, statistically based adjustments for a change in an item's features or quality, according to the bureau's published methodology.
None of these steps happen in isolation: the roughly 80,000 monthly price quotes, the two-year-old expenditure weights, and the choice between a geometric mean and a modified Laspeyres formula all feed the same final number. A change in any one input — a substituted product, an updated set of Consumer Expenditure Survey weights, a shift in which outlets get sampled — can move the reported index even when the prices shoppers see on a given shelf haven't changed at all, which is why the bureau documents each stage of the calculation in detail rather than publishing a single headline figure without its methodology.
For a related markets perspective, read How the Consumer Price Index Turns 80,000 Prices Into One Number.
For more context, read Complete Guide to Comic Book Collecting for Beginners.
For more context, read The Real Cost of a First Hire, Itemized.
For more context, read What the End of the $800 Duty-Free Limit Costs You.